Replication Workflow for danRerLib Analysis
Introduction
This Jupyter Notebook contains the reproducible results presented in the associated publication available in this GitHub Repository (see README for more information on the publication). The primary objectives of this notebook are: (1) to showcase the applicability and novelty of the danRerLib Python package and (2) to offer users a step-by-step, reproducible workflow that demonstrates how to effectively utilize danRerLib for transcriptomic analysis in zebrafish research. Through this notebook, users can replicate the analyses performed in the associated publication and gain insights into the capabilities of danRerLib for their own research.
Requirements
To run this workflow, ensure that the following Python packages are installed on your system. Most of these packages are commonly included in Python distributions, but if any are missing, you can install them using the following commands:
!pip install pandas
!pip install numpy
!pip install matplotlib
!pip install statsmodels
Additionally, for the danRerLib package, it can be easily installed via pip. Execute the following command to install the danRerLib package:
!pip install danrerlib
If you prefer a clean and isolated environment for this workflow, consider creating a virtual environment. Here’s an example of creating a virtual environment named “myenv”:
# Create a virtual environment
python -m venv myenv

# Activate the virtual environment
# On Windows:
.\myenv\Scripts\activate
# On macOS/Linux:
source myenv/bin/activate
Make sure to activate your Python environment or virtual environment before running these commands. This ensures that the packages are installed in the correct environment. If you are not familiar with virtual environments, you can refer to the official Python documentation on virtual environments for more detailed information.
Data Preparation
The differential expression data used in this workflow was generated in a previous publication using RNA sequencing to identify genes differentially expressed following exposure to tris(4-chlorophenyl)methanol (TCPMOH) in zebrafish embryos [1]. The data is publicly available on the Gene Expression Omnibus (GEO) under the accession number GSE165920.
Accessing the Data
To access the data, you can visit the GEO database and search for the accession number GSE165920 and download the supplementary file. The detailed description of the data can be found in the associated publication. Alternatively, for your convenience, the downloaded data used in this analysis has also been included in this repository here.
Analysis Workflow
In this workflow, we will perform functional enrichment analysis using the logistic regression method provided by the danrerlib Python package. This method leverages multiple modules within the package, streamlining the analysis process for user convenience. We will conduct the analysis using zebrafish annotations alone and leverage the orthology capabilities of danRerLib. If you were to utilize danRerLib, we recommend using the hybrid orthology method via logistic regression as shown here.
Step 1: Import Libraries
To utilize danrerlib, you will need to import it directly into the workspace. We will be utilizing the enrich_logistic function from the enrichment module and some visualization functions from the enrichplots module. To import these functions and modules only, you can do so as:
from danrerlib.enrichment import enrich_logistic
import danrerlib.enrichplots as ep
It is also necessary to import useful packages to help us handle the data. We will be using the pandas package for this:
import pandas as pd

# just a notebook display option
from IPython.display import Markdown
Step 2: Loading Data
Begin by loading the differential expression data into your Jupyter Notebook. You can use the following code as an example:
data_path = 'data/GSE165920_DMSO_vs_TCPMOH_DESeq2_Result_GeneSymbol_Verbose.txt'
df = pd.read_csv(data_path, sep = '\t')
It’s crucial to examine the loaded data to ensure that the necessary information for enrichment testing is available. In the context of danRerLib, the required data includes the Gene ID, the associated log2 fold change (log2FC) and the associated p-value of differential expression. To inspect the data provided in the public dataset, we can take a closer look at the column headers:
# Display column headers
print(df.columns)
Index(['LLgeneID', 'LLgeneSymbol (V4.3.2.gtf)', 'LLchr', 'LLstart', 'LLend',
       'LLstrand', 'geneName', 'Ens99geneIDversion', 'EntrezGeneID',
       'ZFINgeneID', 'Base mean', 'log2(FC)', 'StdErr', 'Wald-Stats',
       'P-value', 'P-adj'],
      dtype='object')
We can see that we have the following columns that are required by danRerLib:
EntrezGeneID: The Gene ID in NCBI format. This is an integer Gene ID.log2(FC): The log 2 fold change for the associated genes.P-adj: The adjusted p-value for the differential expression. We chosseP-adjinstead ofP-valueasP-adjcorrect for the multiple testing.
We can get the necessary data by filtering the original dataframe:
df_necessary_data = df[['EntrezGeneID', 'P-adj', 'log2(FC)']].dropna()
To inspect what the data looks like, we can print the first few rows of the data.
df_necessary_data.head(5)
| EntrezGeneID | P-adj | log2(FC) | |
|---|---|---|---|
| 0 | 564531.0 | 2.490000e-36 | -1.135762 |
| 1 | 560210.0 | 1.230000e-25 | -1.050871 |
| 2 | 83776.0 | 2.500000e-22 | -0.702291 |
| 3 | 100003999.0 | 1.810000e-21 | -1.121619 |
| 4 | 541386.0 | 7.470000e-21 | -0.830242 |
We can see that the Gene ID is an is reading in as a float, not an integer. This is a problem because the Entrez Gene ID as defined by NCBI is an integer. To make sure we don’t run into any other issues, we can force the Gene ID column to be of integer format using the following code:
df_necessary_data['EntrezGeneID'] = df_necessary_data['EntrezGeneID'].astype(int)
df_necessary_data.head(5)
| EntrezGeneID | P-adj | log2(FC) | |
|---|---|---|---|
| 0 | 564531 | 2.490000e-36 | -1.135762 |
| 1 | 560210 | 1.230000e-25 | -1.050871 |
| 2 | 83776 | 2.500000e-22 | -0.702291 |
| 3 | 100003999 | 1.810000e-21 | -1.121619 |
| 4 | 541386 | 7.470000e-21 | -0.830242 |
Step 3: Perform danRerLib Analysis
We are interested in investigating the enrichment results using the Kyoto Encyclopedia of Genes and Genomes (KEGG) Pathways that have been annotated for zebrafish directly verses those that have been annotated for humans as well. A reminder that danRerLib defines the zebrafish organism as dre and the mapped zebrafish organism (defined via orthology from humans) as dreM. To use both the zebrafish and mapped zebrafish annotations with zebrafish annotations as the default, the organism should be variable.
Enrichment Analysis for Zebrafish (dre) Annotated Pathways:
results_dre = enrich_logistic(
             gene_universe = df_necessary_data,
             gene_id_type = 'Entrez Gene ID',
             database = 'KEGG Pathway',
             org = 'dre')
To get a quick peek at these results, we can look at the first two entries:
%%capture
# ^ suppresses output
# Markdown(results_dre.head(2).to_markdown())
results_dre.head(2)
Concept Type |
Concept ID |
Concept Name |
# Genes in Concept in Universe |
# Sig Genes Belong to Concept |
Proportion of Sig Genes in Set |
Odds Ratio |
P-value |
Direction |
Bonferroni |
BH FDR |
|
|---|---|---|---|---|---|---|---|---|---|---|---|
0 |
KEGG Pathway |
dre01100 |
Metabolic pathways |
1638 |
57 |
0.0347985 |
0.735718 |
2.2975e-09 |
downregulated |
3.79087e-07 |
3.79087e-07 |
1 |
KEGG Pathway |
dre03008 |
Ribosome biogenesis in eukaryotes |
74 |
12 |
0.162162 |
0.796797 |
5.36501e-06 |
downregulated |
0.000885227 |
0.000442613 |
Enrichment Analysis for Variable (zebrafish and human) Annotated Pathways:
results_variable = enrich_logistic(
             gene_universe = df_necessary_data,
             gene_id_type = 'Entrez Gene ID',
             database = 'KEGG Pathway',
             org = 'variable')
Again, to get a quick peek at these results, we can look at the first two entries:
%%capture
# ^ suppresses output
# Markdown(results_variable.head(2).to_markdown())
results_variable.head(2)
Concept Type |
Concept ID |
Concept Name |
# Genes in Concept in Universe |
# Sig Genes Belong to Concept |
Proportion of Sig Genes in Set |
Odds Ratio |
P-value |
Direction |
Bonferroni |
BH FDR |
|
|---|---|---|---|---|---|---|---|---|---|---|---|
0 |
KEGG Pathway |
dre01100 |
Metabolic pathways |
1638 |
57 |
0.0347985 |
0.735718 |
2.2975e-09 |
downregulated |
3.79087e-07 |
3.79087e-07 |
1 |
KEGG Pathway |
dreM05321 |
Inflammatory bowel disease |
27 |
2 |
0.0740741 |
1.90326 |
3.07117e-06 |
upregulated |
0.000534384 |
0.000534384 |
Step 4: Interpretation
To provide a quick overview of the results and output, the following describes each column in the enrichment analysis output:
Column Name |
Description |
|---|---|
Concept Type |
The database tested from, in this case it is ‘KEGG Pathway’. |
Concept ID |
The ID for the concept, or pathway, from the associated Concept Type, or database. You’ll notice that the concepts from using zebrafish only have a prefix of |
Concept Name |
The name of the concept. |
# Genes in Concept in Universe |
The number of genes in the concept that are found in the dataset provided. |
# Sig Genes Belong to Concept |
The number of significant genes in the dataset provided that are in the concept. |
Proportion of Sig Genes in Set |
The number of significant genes in the concept divided by the total number of genes in the concept |
Odds Ratio |
The odds ratio measures the likelihood of finding significant genes in the analyzed concept compared to the rest of the genes in the dataset. |
P-value |
The p-value indicating the significance of the enrichment. |
Direction |
Indicates whether the genes in the concept are upregulated or downregulated in the dataset. |
Bonferrnoi |
Adjusted p-value using the Bonferroni method. |
BH FDR |
Adjusted p-value using the BH FDR method. |
We can take a look further into the top 10 upregulated and top 10 downregulated genes per methodology.
To get the top 10 upregulated for the dre case, we can execute the following code:
%%capture
# ^ suppresses output
# Markdown(results_dre[ results_dre['Direction'] == 'upregulated' ].head(10).to_markdown())
results_dre[ results_dre['Direction'] == 'upregulated' ].head(10)
Concept Type |
Concept ID |
Concept Name |
# Genes in Concept in Universe |
# Sig Genes Belong to Concept |
Proportion of Sig Genes in Set |
Odds Ratio |
P-value |
Direction |
Bonferroni |
BH FDR |
|
|---|---|---|---|---|---|---|---|---|---|---|---|
4 |
KEGG Pathway |
dre04510 |
Focal adhesion |
264 |
3 |
0.0113636 |
1.50245 |
7.87898e-05 |
upregulated |
0.0130003 |
0.00251133 |
6 |
KEGG Pathway |
dre04514 |
Cell adhesion molecules |
136 |
4 |
0.0294118 |
1.56559 |
0.000172863 |
upregulated |
0.0285224 |
0.00375606 |
8 |
KEGG Pathway |
dre04744 |
Phototransduction |
44 |
4 |
0.0909091 |
1.73158 |
0.000204876 |
upregulated |
0.0338045 |
0.00375606 |
10 |
KEGG Pathway |
dre04512 |
ECM-receptor interaction |
96 |
2 |
0.0208333 |
1.53093 |
0.000509433 |
upregulated |
0.0840564 |
0.00764149 |
11 |
KEGG Pathway |
dre03460 |
Fanconi anemia pathway |
44 |
2 |
0.0454545 |
1.55945 |
0.000790771 |
upregulated |
0.130477 |
0.0104595 |
13 |
KEGG Pathway |
dre03030 |
DNA replication |
36 |
1 |
0.0277778 |
1.55237 |
0.00101622 |
upregulated |
0.167677 |
0.0119769 |
14 |
KEGG Pathway |
dre04371 |
Apelin signaling pathway |
176 |
4 |
0.0227273 |
1.40889 |
0.00124234 |
upregulated |
0.204985 |
0.0136657 |
17 |
KEGG Pathway |
dre04520 |
Adherens junction |
136 |
2 |
0.0147059 |
1.40642 |
0.00208362 |
upregulated |
0.343797 |
0.0190998 |
18 |
KEGG Pathway |
dre04810 |
Regulation of actin cytoskeleton |
279 |
4 |
0.0143369 |
1.32796 |
0.00261093 |
upregulated |
0.430804 |
0.0214994 |
23 |
KEGG Pathway |
dre04020 |
Calcium signaling pathway |
293 |
3 |
0.0102389 |
1.31456 |
0.00321531 |
upregulated |
0.530527 |
0.0221053 |
Similarly for the variable case, we can execute a similar code:
%%capture
# ^ suppresses output
# Markdown(results_variable[ results_variable['Direction'] == 'upregulated' ].head(10).to_markdown())
results_variable[ results_variable['Direction'] == 'upregulated' ].head(10)
Concept Type |
Concept ID |
Concept Name |
# Genes in Concept in Universe |
# Sig Genes Belong to Concept |
Proportion of Sig Genes in Set |
Odds Ratio |
P-value |
Direction |
Bonferroni |
BH FDR |
|
|---|---|---|---|---|---|---|---|---|---|---|---|
1 |
KEGG Pathway |
dreM05321 |
Inflammatory bowel disease |
27 |
2 |
0.0740741 |
1.90326 |
3.07117e-06 |
upregulated |
0.000534384 |
0.000534384 |
4 |
KEGG Pathway |
dreM04062 |
Chemokine signaling pathway |
162 |
4 |
0.0246914 |
1.50238 |
5.90899e-05 |
upregulated |
0.0102816 |
0.00379117 |
6 |
KEGG Pathway |
dreM04659 |
Th17 cell differentiation |
82 |
3 |
0.0365854 |
1.57993 |
6.5365e-05 |
upregulated |
0.0113735 |
0.00379117 |
7 |
KEGG Pathway |
dre04510 |
Focal adhesion |
264 |
3 |
0.0113636 |
1.50245 |
7.87898e-05 |
upregulated |
0.0130003 |
0.00251133 |
9 |
KEGG Pathway |
dreM04014 |
Ras signaling pathway |
247 |
4 |
0.0161943 |
1.41846 |
0.000151207 |
upregulated |
0.0263101 |
0.00512741 |
10 |
KEGG Pathway |
dre04514 |
Cell adhesion molecules |
136 |
4 |
0.0294118 |
1.56559 |
0.000172863 |
upregulated |
0.0285224 |
0.00375606 |
11 |
KEGG Pathway |
dreM04724 |
Glutamatergic synapse |
138 |
2 |
0.0144928 |
1.478 |
0.000181587 |
upregulated |
0.0315961 |
0.00512741 |
13 |
KEGG Pathway |
dre04744 |
Phototransduction |
44 |
4 |
0.0909091 |
1.73158 |
0.000204876 |
upregulated |
0.0338045 |
0.00375606 |
14 |
KEGG Pathway |
dreM04725 |
Cholinergic synapse |
131 |
2 |
0.0152672 |
1.47913 |
0.000205036 |
upregulated |
0.0356763 |
0.00512741 |
15 |
KEGG Pathway |
dreM05412 |
Arrhythmogenic right ventricular cardiomyopathy |
103 |
2 |
0.0194175 |
1.50175 |
0.000225511 |
upregulated |
0.0392388 |
0.00512741 |
For downregulated pathways, you can run similar code again:
%%capture
# ^ suppresses output
# Markdown(results_dre[ results_dre['Direction'] == 'downregulated' ].head(10).to_markdown())
results_dre[ results_dre['Direction'] == 'downregulated' ].head(10)
Concept Type |
Concept ID |
Concept Name |
# Genes in Concept in Universe |
# Sig Genes Belong to Concept |
Proportion of Sig Genes in Set |
Odds Ratio |
P-value |
Direction |
Bonferroni |
BH FDR |
|
|---|---|---|---|---|---|---|---|---|---|---|---|
0 |
KEGG Pathway |
dre01100 |
Metabolic pathways |
1638 |
57 |
0.0347985 |
0.735718 |
2.2975e-09 |
downregulated |
3.79087e-07 |
3.79087e-07 |
1 |
KEGG Pathway |
dre03008 |
Ribosome biogenesis in eukaryotes |
74 |
12 |
0.162162 |
0.796797 |
5.36501e-06 |
downregulated |
0.000885227 |
0.000442613 |
2 |
KEGG Pathway |
dre03040 |
Spliceosome |
139 |
3 |
0.0215827 |
0.812757 |
1.74526e-05 |
downregulated |
0.00287968 |
0.000959892 |
3 |
KEGG Pathway |
dre04141 |
Protein processing in endoplasmic reticulum |
196 |
10 |
0.0510204 |
0.830596 |
6.15407e-05 |
downregulated |
0.0101542 |
0.00251133 |
5 |
KEGG Pathway |
dre01240 |
Biosynthesis of cofactors |
177 |
14 |
0.079096 |
0.834689 |
9.13211e-05 |
downregulated |
0.015068 |
0.00251133 |
7 |
KEGG Pathway |
dre02010 |
ABC transporters |
44 |
7 |
0.159091 |
0.821231 |
0.000194014 |
downregulated |
0.0320122 |
0.00375606 |
9 |
KEGG Pathway |
dre00830 |
Retinol metabolism |
69 |
8 |
0.115942 |
0.835146 |
0.000392985 |
downregulated |
0.0648425 |
0.00648425 |
12 |
KEGG Pathway |
dre00980 |
Metabolism of xenobiotics by cytochrome P450 |
55 |
5 |
0.0909091 |
0.836655 |
0.000824083 |
downregulated |
0.135974 |
0.0104595 |
15 |
KEGG Pathway |
dre00860 |
Porphyrin metabolism |
56 |
5 |
0.0892857 |
0.840365 |
0.00132582 |
downregulated |
0.21876 |
0.0136725 |
16 |
KEGG Pathway |
dre00982 |
Drug metabolism - cytochrome P450 |
53 |
4 |
0.0754717 |
0.842789 |
0.00197357 |
downregulated |
0.32564 |
0.0190998 |
%%capture
# ^ suppresses output
# Markdown(results_variable[ results_variable['Direction'] == 'downregulated' ].head(10).to_markdown())
results_variable[ results_variable['Direction'] == 'downregulated' ].head(10)
Concept Type |
Concept ID |
Concept Name |
# Genes in Concept in Universe |
# Sig Genes Belong to Concept |
Proportion of Sig Genes in Set |
Odds Ratio |
P-value |
Direction |
Bonferroni |
BH FDR |
|
|---|---|---|---|---|---|---|---|---|---|---|---|
0 |
KEGG Pathway |
dre01100 |
Metabolic pathways |
1638 |
57 |
0.0347985 |
0.735718 |
2.2975e-09 |
downregulated |
3.79087e-07 |
3.79087e-07 |
2 |
KEGG Pathway |
dre03008 |
Ribosome biogenesis in eukaryotes |
74 |
12 |
0.162162 |
0.796797 |
5.36501e-06 |
downregulated |
0.000885227 |
0.000442613 |
3 |
KEGG Pathway |
dre03040 |
Spliceosome |
139 |
3 |
0.0215827 |
0.812757 |
1.74526e-05 |
downregulated |
0.00287968 |
0.000959892 |
5 |
KEGG Pathway |
dre04141 |
Protein processing in endoplasmic reticulum |
196 |
10 |
0.0510204 |
0.830596 |
6.15407e-05 |
downregulated |
0.0101542 |
0.00251133 |
8 |
KEGG Pathway |
dre01240 |
Biosynthesis of cofactors |
177 |
14 |
0.079096 |
0.834689 |
9.13211e-05 |
downregulated |
0.015068 |
0.00251133 |
12 |
KEGG Pathway |
dre02010 |
ABC transporters |
44 |
7 |
0.159091 |
0.821231 |
0.000194014 |
downregulated |
0.0320122 |
0.00375606 |
17 |
KEGG Pathway |
dreM05204 |
Chemical carcinogenesis - DNA adducts |
23 |
2 |
0.0869565 |
0.775179 |
0.000265211 |
downregulated |
0.0461467 |
0.00512741 |
19 |
KEGG Pathway |
dre00830 |
Retinol metabolism |
69 |
8 |
0.115942 |
0.835146 |
0.000392985 |
downregulated |
0.0648425 |
0.00648425 |
23 |
KEGG Pathway |
dre00980 |
Metabolism of xenobiotics by cytochrome P450 |
55 |
5 |
0.0909091 |
0.836655 |
0.000824083 |
downregulated |
0.135974 |
0.0104595 |
28 |
KEGG Pathway |
dre00860 |
Porphyrin metabolism |
56 |
5 |
0.0892857 |
0.840365 |
0.00132582 |
downregulated |
0.21876 |
0.0136725 |
You will notice that the results in the variable case are slightly different than the dre case alone. This is because we also tested for pathways that are not annotated for zebrafish using orthology built into danRerLib. For a detailed description of the biological underpinnings of these findings, please refer to the publication.
Step 5: Visualization
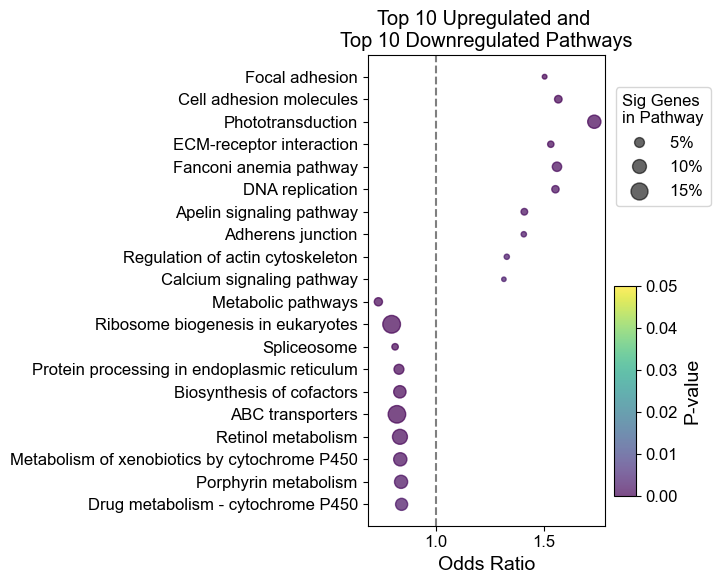
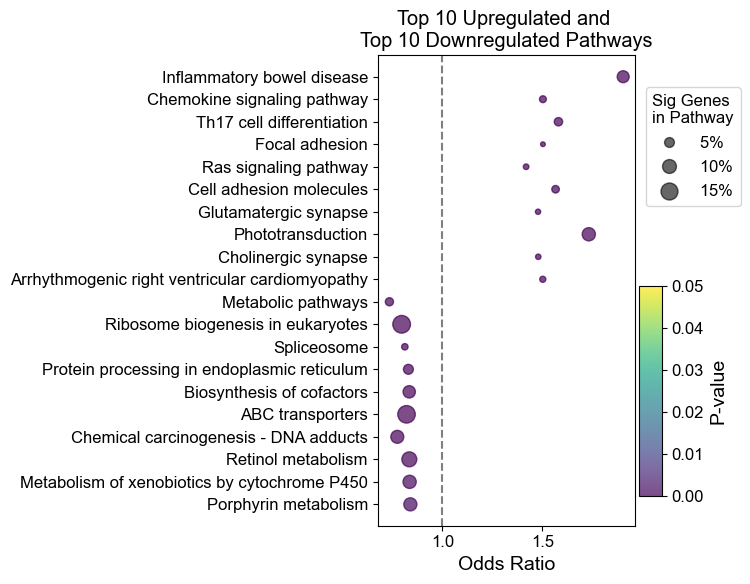
We can create some plots to visualize the up and downregulated pathways for each methodology. To do so, we use the enrich_plots module which we imported earlier as ep. There are a couple of different plotting options available. I will begin by showing the plots utilized in the publication:
ep.dotplot(results_dre, 20, 'both')
ep.dotplot(results_variable, 20, 'both')
To show some of the other plotting options, here are some other useful plots you can generate using danRerLib:
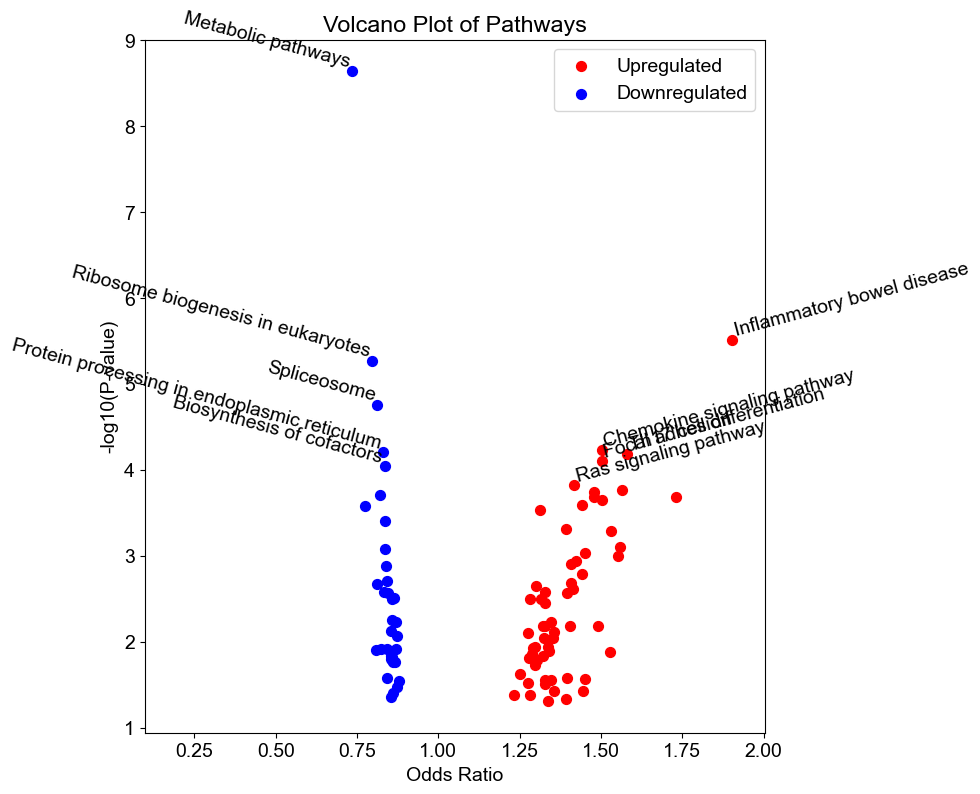
A volcano plot showing the significantly upregulated and downregulated pathways:
ep.volcano(results_variable, legend_loc='best')
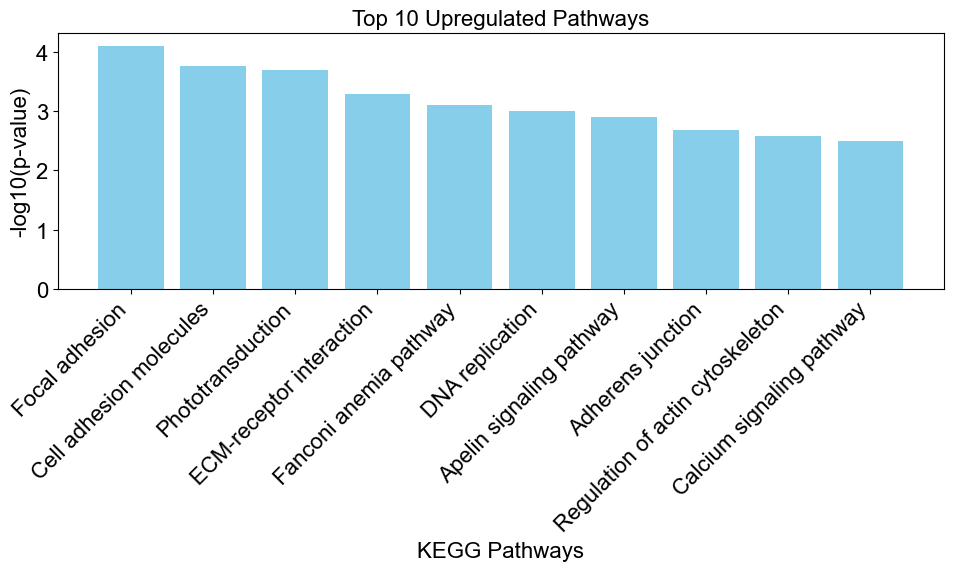
A bar chart showing the top 10 upregulated pathways and the strength of the significance:
upregulated_pathways_dre = results_dre[ results_dre['Direction']=='upregulated' ]
ep.bar_chart(data = upregulated_pathways_dre,
             title = 'Top 10 Upregulated Pathways',
             xlab = 'KEGG Pathways',
             max_num_pathways=10)
dre_up = (results_dre[ (results_dre['Direction'] == 'upregulated') & (results_dre['P-value'] < 0.05) ] )
dre_down = (results_dre[ (results_dre['Direction'] == 'downregulated') & (results_dre['P-value'] < 0.05) ] )
dre_sig = (results_dre[ (results_dre['P-value'] < 0.05) ] )
variable_up = (results_variable[ (results_variable['Direction'] == 'upregulated') & (results_variable['P-value'] < 0.05) ] )
variable_down = (results_variable[ (results_variable['Direction'] == 'downregulated') & (results_variable['P-value'] < 0.05) ] )
variable_sig = (results_variable[ (results_variable['P-value'] < 0.05) ] )
print(f'Number dre upregulated: {len(dre_up)}')
print(f'Number dre downregulated: {len(dre_down)}')
print(f'Number dre total significant: {len(dre_sig)}')
print(f'Number variable upregulated: {len(variable_up)}')
print(f'Number variable downregulated: {len(variable_down)}')
print(f'Number variable total significant: {len(variable_sig)}')
Number dre upregulated: 29
Number dre downregulated: 26
Number dre total significant: 55
Number variable upregulated: 60
Number variable downregulated: 35
Number variable total significant: 95
results_dreM = enrich_logistic(
             gene_universe = df_necessary_data,
             gene_id_type = 'Entrez Gene ID',
             database = 'KEGG Pathway',
             org = 'dreM')
results_dreM['Concept ID'] = results_dreM['Concept ID'].apply(lambda x: x.replace('dreM', 'dre'))
dreM_sig = (results_dreM[ (results_dreM['P-value'] < 0.05) ] )
# Find common pathway names
common_pathways = set(dre_sig['Concept ID']).intersection(dreM_sig['Concept ID'])
print(f"Number of common significant pathways: {len(common_pathways)}")

pathways_not_in_dreM = set(dre_sig['Concept ID']).difference(dreM_sig['Concept ID'])

# Print the number of pathways and the actual names
print(f"Number of significant pathways in dre not significant in dreM: {len(pathways_not_in_dreM)}")

pathways_not_in_dre = set(dreM_sig['Concept ID']).difference(dre_sig['Concept ID'])

# Print the number of pathways and the actual names
print(f"Number of significant pathways in dreM not significant in dre: {len(pathways_not_in_dre)}")
Number of common significant pathways: 42
Number of significant pathways in dre not significant in dreM: 13
Number of significant pathways in dreM not significant in dre: 43
Conclusion
danRerLib is a specialized and efficient tool tailored for zebrafish researchers engaging in functional enrichment analysis within Python. Through this tutorial and the associated publication, danRerLib can overcome the limitations of the lack of direct zebrafish annotations. Through the integration of orthology, the package enables researchers to delve into unannotated pathways, providing valuable insights.
References
[1]: Navarrete, J., et al. The ecotoxicological contaminant tris(4-chlorophenyl)methanol (TCPMOH) impacts embryonic development in zebrafish (Danio rerio). Aquatic Toxicology. 2021;235:105815.